

Realistically assessing the living standards of its population and making policies or decisions which promote consistent improvement is of utmost priority in any democratic country.
How does Mongolia assess the standards of living for its population? How clear or concrete is the methodology for individuals or policymakers? Can it serve as a vital tool for their work? Wouldn’t it be more efficacious if the statistical approach is simple and easy to understand and use?
“The natural effort of every individual to better his own condition persists from birth to death” (Adam Smith). Economic theory dictates that an individual seeks to maximize their consumption, whereas nobody uses others’ money as carefully as they would use their own. Since state funds belong to the taxpayers, not individuals, the citizens have the right to monitor spending and demand efficiency.
Our current methodology
Mongolia examines the livelihood of its population by assessing the standards of living by ranking consumption and categorizing the citizens as poor and not poor. The ‘poor’ refers to people with low income and education, poor health and nutrition, and a lack of consumer goods. They have no ability to express political views. Moreover, insufficient infrastructure accessibility, limited freedom, and substandard living conditions are common characteristics.
People’s monthly spending is calculated by monetary and non-monetary indicators. Although accommodation conditions, address availability, literacy, health, and nutrition are non-monetary indicators, measuring spending’s in years is expensive, not to mention the calculation in months.
It is even harder to measure the standards of living by income, as one-third of all households are dependent on seasonal work in agriculture, building and road construction. Income volatility and hidden income are deemed as hindrance to assessment.
International organizations, including the World Bank, recommend assessing spending’s by groups in poverty statistic methodology. The groups are food-related and non-food-related: housing, goods with extended usage, fuel, and energy. However, it is still a challenge to check if those items were actually used, how inflation was taken into account, what the factors of price regulation and subsidies were, and how realistic the spending was divided among the family members.
Therefore, there is only one separation, which is the poverty line. Food poverty, for example, is defined as consuming lower than 40% of daily nutrition and “the food basket.” Non-food poverty concerns the monthly spending in the areas of health, education, rent, heating, and transportation. According to the latest census in 2016, 29.6% or 907.5 thousand of Mongolia’s 3.1 million people lived in poverty.
How realistic or practical is a spending ranging from “poor” to “rich” divided into five equal portions? The National Statistics Office table for monthly expenditures per person:

A method anyone can understand and adopt
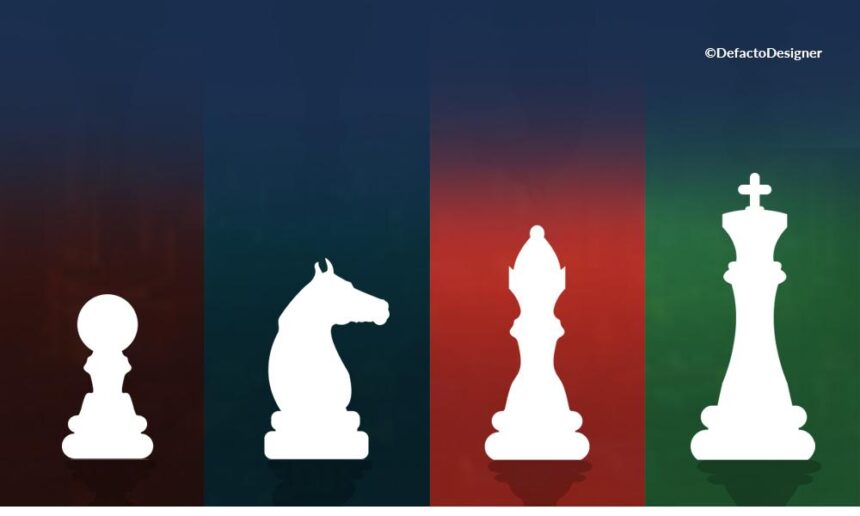
Hans Rosling, a famous Swedish doctor, came up with a simple methodology for an income level framework. He worked long-term in many countries around the world, especially in Africa, where he became familiar with the origins of poverty while studying various diseases and plagues.
His framework classifies inhabitants of any country into four levels and presents pictures of their drinking water, transportation, cooking, eating, and sleeping. The simplified approach is of substantial importance for practice.
The classifications by H. Rosling are as follows: Level 1 if the daily income per household member is less than 2 dollars (~ 6K tugriks); up to 8 dollars (24K) for Level 2; up to 32 dollars (96K) for Level 3; and Level 4 if higher. For example, people in Level 1 carry drinking water from wells by hand, while the Level 2 group transports it by bicycle, whereas the Level 3 group takes it from a centralized distribution point, and the Level 4 group uses tap water at home. Of the world’s 7 billion people, 1 billion live at Level 1, 3 billion at Level 2, 2 billion at Level 3, and the remaining 1 billion at Level 4. At Level 4, people in nearly anywhere in the world live in almost the same conditions.
It will be helpful in many ways if this easy-to-understand method is used in Mongolia with the condition of the toilets as one of the indicators to assess the living standards of our citizens by aimags, soums, and districts. Suppose we manage to make such an assessment to determine the quality of life for the people living in the respective administrative unit. In that case, a significant difference can be made to develop and implement the right government policy for improving the quality of life, encouraging upward shifts (social mobility), and enhancing governance management. It is believed that the things that cannot be measured cannot be controlled. Besides, only an actual statistician might have the ability to measure and evaluate the official statistical methodology.

According to H. Rosling’s studies, transitioning from level 1 to level 2 takes 20 years or an entire generation on average, while the following shifts require shorter amounts of time. What’s more, the country’s quality of health and education, as well as the level of development, play critical roles in the citizens’ shift to the higher levels. Simple measurement and understanding of life quality will make tangible changes in the national, regional, and individual developments.
2021.03.29
Trans. by Riya.T and Munkh-Erdene.D