“Officially registered small and medium-sized enterprises (referred to as SMEs) constitute 40% of GDP and provide 50% of employment in developing countries, playing a crucial role in the economy (World Bank). SMEs make a significant contribution to poverty reduction by creating many jobs.
As of 2021, 66% of active businesses in Mongolia are engaged in small and medium production and service sectors, making up 5.5% of GDP, 2.4% of exports, and 9.7% of imports (NSO, 2021). Development Solutions NGO, with funding from the United States Agency for International Development (USAID), has conducted the first-ever study to understand why SMEs in Mongolia have such low engagement and to evaluate their competitiveness.
Research Methodology
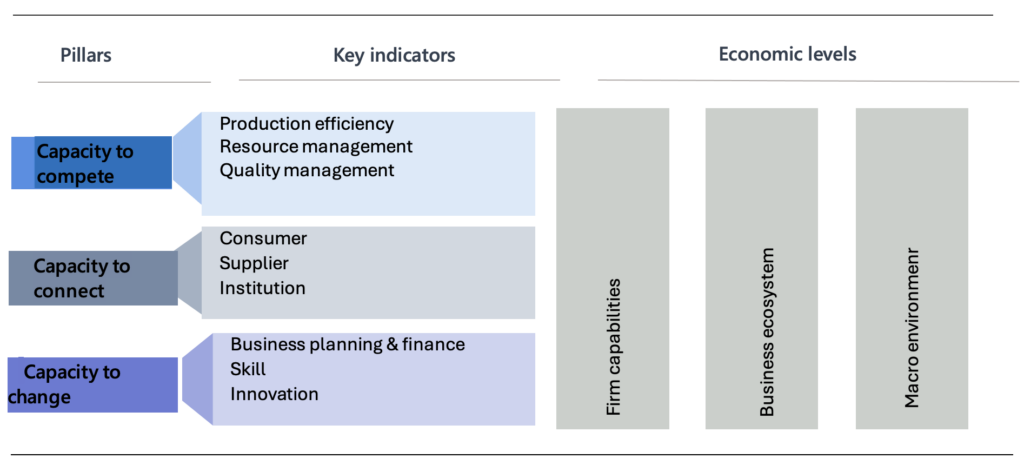
The competitiveness of SMEs in Mongolia was assessed using the SME Competitiveness Grid (Matrix) of the International Trade Center (ITC), evaluating three levels of the economy: firm capabilities, business ecosystem, and macro environment. The study measured capacity to compete, capacity to connect, and capacity to change as three key pillars.” Figure 1.
Figure 1. The SME competitiveness grid (martrix)

Source: International Trade Center (2021b)
“The survey included 703 officially registered SMEs operating in the nine districts of Ulaanbaatar and 21 provinces of Mongolia. Of these, 70% are based in the capital, while 30% operate in rural areas. By income classification, 58% are micro-enterprises, 24% are small, and 18% are medium-sized. By sector, 35% operate in services, 22% in wholesale and retail, 12% in processing, 11% in construction, 10% in agriculture, and 9% in other sectors. Overall, more than half are micro-enterprises concentrated in low value-added trade and service sectors, which aligns with the general profile of SMEs in Mongolia.
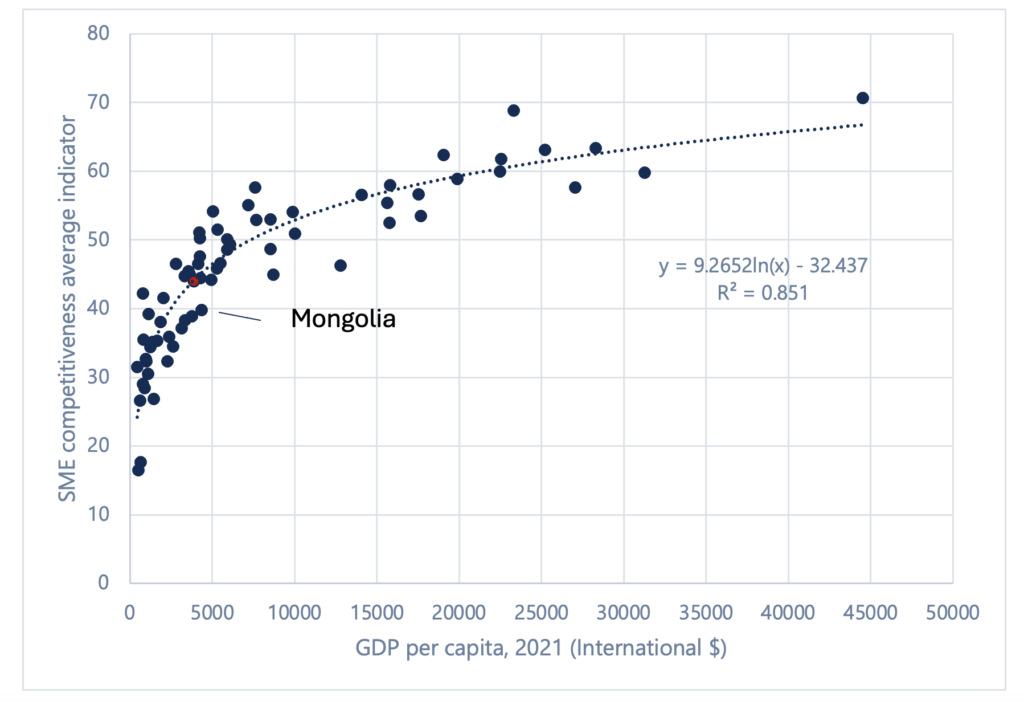
The ITC correlates each country’s competitiveness index with its per capita GDP (Papke and Wooldridge) and uses this as a benchmark in the SME Competitiveness grid for the given country.” Figure 1. The benchmark for Mongolia is 44.2.
Figure 2. Correlation between the average SME competitiveness index and GDP per capita

Source: Researcher’s estimate based on International Trade Center (2021b) data
Scores above 60% of the benchmark are considered strong while scores below that level is considered weak. (Figure 3)
Figure 3. Competitiveness benchmark

Results
As seen in Table 1, the survey indicators reveal:
Firm capabilities: Capacity to connect is lower than the benchmark, and capacity to compete and change are even lower. Capacity to connect for micro-businesses is weak.
Business ecosystem: Capacity to compete and change are are above the benchmark, while capacity to connect is below it.
Macro environment: Capacity to compete is below the benchmark, but capacity to change is rated as good and strong.
Across the three economic levels, capacity to change is higher than the other two pillars.”
Table 1. The SME competitiveness grid summary
| Average score [0-100] | Index | Compete | Connect | Change | |
| Firm capabilities | Total | 48.7 | 49.7 | 42.9 | 53.3 |
| Micro | 44.1 | 46.3 | 38.4 | 47.5 | |
| Small | 52.1 | 52.6 | 47.0 | 56.8 | |
| Medium | 58.3 | 56.8 | 51.7 | 66.5 | |
| Business ecosystem | 52.2 | 56.6 | 42.9 | 57.0 | |
| Macro environment | 57.9 | 39.2 | 57.1 | 77.4 | |
| Benchmark: 44.2 | |||||
| Weak level: £26.5 points | Strong level: ³70.7 points | ||||
The three pillars seen through the main indicators, as displayed in table 2, reveal:
Capacity to compete: Regardless of size, SMEs rarely obtain domestic or international quality certifications. However, resource management and production efficiency are above the benchmark, with resource management being particularly strong for medium-sized businesses.
Capacity to connect: Customer and institutional connectivity are below the benchmark, meaning SMEs rarely make effort into building effective relationships with customers or utilizing customer information. This is the case especially for micro and small businesses. Moreover, SMESs, regardless of size, lag behind on institutional strengthening and collaboration with industry associations and professional organizations.
Capacity to change: Although capacity to change is above the benchmark, the level of innovation is relatively low, especially for micro-businesses. For medium-sized businesses, however, skilled human resources are at a strong level.
Table 2. The SME competitiveness grid summary, levels of main indicators
| Pillars | Main idicators | Firm capabilities | Business ecosystem | Macro env. | |||
| Total | Micro | Small | Medium | ||||
| Capacity to compete | Production efficiency | 56.4 | 54.9 | 57.7 | 59.9 | 55.2 | 49.3 |
| Resource management | 65.3 | 62.3 | 67.0 | 72.6 | 68.7 | 25.0 | |
| Quality management | 27.5 | 21.7 | 33.2 | 38 | 45.9 | 31.3 | |
| Capacity to connect | Consumer | 33.9 | 28.2 | 37.9 | 46.4 | 41.0 | 51.3 |
| Supplier | 58.8 | 54.0 | 63.6 | 67.8 | 40.2 | 68.9 | |
| Institution | 36.1 | 32.9 | 39.6 | 41.1 | 47.5 | 62.6 | |
| Capacity to change | Business planning and finance | 54.9 | 48.6 | 60.1 | 67.8 | 68.3 | 76.8 |
| Skills | 59.6 | 54.6 | 61.4 | 72.9 | 53.2 | 85.6 | |
| Innovation | 45.3 | 39.4 | 49.0 | 58.7 | 49.5 | 73.7 | |
| Benchmark: 44.2 | |||||||
| Weak level: £26.5 points | Strong level: ³70.7 points | ||||||
“This study report provides a detailed explanation on how all the variables intersecting along the vertical and horizontal axes of the matrix were derived and why such scores were given.
For example, companies’ capacity to change was assessed based on indicators such as finance, skilled human resources, and innovation development across the three economic levels.
For most SMEs, access to finance has improved, and they have obtained a certain level of skilled human resources, but more effort is required for their capacity-building and continuous training. As for the sector, there is a need to increase the availability of professionally skilled workers and to improve the accessibility and quality of major training institutions. At the firm level, some efforts are being made toward innovation development, but they lack tangible results or sufficiently formalized outcomes. Furthermore, the business environment was assessed as lacking collaboration between professional and business organizations to support innovation development.
A detailed review of each dataset in this report will undoubtedly prove useful for SME entrepreneurs, professional associations, and policymakers and implementers in the government.
Entrepreneurs can also use this methodology to assess their company’s competitiveness by clicking here.”


